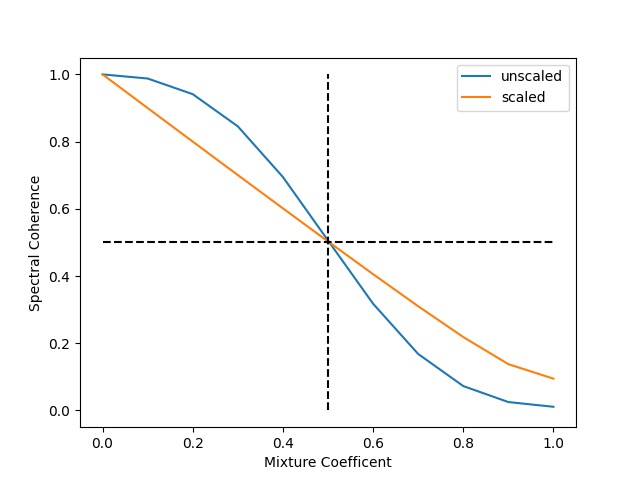
Linearize the spectral coherence
Top
Questions to David Rotermund
Let us assume we have two time series (white in spectrum)
Wouldn’t it to be nice if the spectral coherence would be
For white times series with the length of infinity this can be achived via the transformation
coherence_scaled = 1.0 / (1.0 + np.sqrt((1.0 / coherence) - 1.0))
see Attention Selectively Gates Afferent Signal Transmission to Area V4 for details
The emphesis lies on infinity and a white spectrum. For shorter time series the results might vary.
import numpy as np
import matplotlib.pyplot as plt
import pywt  # type: ignore
from tqdm import trange  # type: ignore


# Calculate the wavelet scales we requested
def calculate_wavelet_scale(
    number_of_frequences: int,
    frequency_range_min: float,
    frequency_range_max: float,
    dt: float,
) -> np.ndarray:
    s_spacing: np.ndarray = (1.0 / (number_of_frequences - 1)) * np.log2(
        frequency_range_max / frequency_range_min
    )
    scale: np.ndarray = np.power(2, np.arange(0, number_of_frequences) * s_spacing)
    frequency_axis_request: np.ndarray = frequency_range_min * np.flip(scale)
    return 1.0 / (frequency_axis_request * dt)


def get_y_ticks(
    reduction_to_ticks: int, frequency_axis: np.ndarray, round: int
) -> tuple[np.ndarray, np.ndarray]:
    output_ticks = np.arange(
        0,
        frequency_axis.shape[0],
        int(np.floor(frequency_axis.shape[0] / reduction_to_ticks)),
    )
    if round < 0:
        output_freq = frequency_axis[output_ticks]
    else:
        output_freq = np.round(frequency_axis[output_ticks], round)
    return output_ticks, output_freq


def get_x_ticks(
    reduction_to_ticks: int, dt: float, number_of_timesteps: int, round: int
) -> tuple[np.ndarray, np.ndarray]:
    time_axis = dt * np.arange(0, number_of_timesteps)
    output_ticks = np.arange(
        0, time_axis.shape[0], int(np.floor(time_axis.shape[0] / reduction_to_ticks))
    )
    if round < 0:
        output_time_axis = time_axis[output_ticks]
    else:
        output_time_axis = np.round(time_axis[output_ticks], round)
    return output_ticks, output_time_axis


def calculate_cone_of_influence(dt: float, frequency_axis: np.ndarray):
    wave_scales = 1.0 / (frequency_axis * dt)
    cone_of_influence: np.ndarray = np.ceil(np.sqrt(2) * wave_scales).astype(np.int64)
    return cone_of_influence


def mask_cone_of_influence(
    complex_spectrum: np.ndarray,
    cone_of_influence: np.ndarray,
    fill_value: float = np.NaN,
) -> np.ndarray:
    assert complex_spectrum.shape[0] == cone_of_influence.shape[0]

    for frequency_id in range(0, cone_of_influence.shape[0]):
        # Front side
        start_id: int = 0
        end_id: int = int(
            np.min((cone_of_influence[frequency_id], complex_spectrum.shape[1]))
        )
        complex_spectrum[frequency_id, start_id:end_id] = fill_value

        start_id = np.max(
            (
                complex_spectrum.shape[1] - cone_of_influence[frequency_id] - 1,
                0,
            )
        )
        end_id = complex_spectrum.shape[1]
        complex_spectrum[frequency_id, start_id:end_id] = fill_value

    return complex_spectrum


def calculate_wavelet_tf_complex_coeffs(
    data: np.ndarray,
    number_of_frequences: int = 25,
    frequency_range_min: float = 15,
    frequency_range_max: float = 200,
    dt: float = 1.0 / 1000,
) -> tuple[np.ndarray, np.ndarray, np.ndarray]:

    assert data.ndim == 1
    t: np.ndarray = np.arange(0, data.shape[0]) * dt

    # The wavelet we want to use
    mother = pywt.ContinuousWavelet("cmor1.5-1.0")

    wave_scales = calculate_wavelet_scale(
        number_of_frequences=number_of_frequences,
        frequency_range_min=frequency_range_min,
        frequency_range_max=frequency_range_max,
        dt=dt,
    )

    complex_spectrum, frequency_axis = pywt.cwt(
        data=data, scales=wave_scales, wavelet=mother, sampling_period=dt
    )

    return (complex_spectrum, frequency_axis, t)


def calculate_spectral_coherence(
    n_trials: int,
    y_a: np.ndarray,
    y_b: np.ndarray,
    number_of_frequences: int,
    frequency_range_min: float,
    frequency_range_max: float,
    dt: float,
) -> tuple[np.ndarray, np.ndarray, np.ndarray]:

    for trial_id in range(0, n_trials):
        wave_data_a, frequency_axis, t = calculate_wavelet_tf_complex_coeffs(
            data=y_a[..., trial_id],
            number_of_frequences=number_of_frequences,
            frequency_range_min=frequency_range_min,
            frequency_range_max=frequency_range_max,
            dt=dt,
        )

        wave_data_b, frequency_axis, t = calculate_wavelet_tf_complex_coeffs(
            data=y_b[..., trial_id],
            number_of_frequences=number_of_frequences,
            frequency_range_min=frequency_range_min,
            frequency_range_max=frequency_range_max,
            dt=dt,
        )

        cone_of_influence = calculate_cone_of_influence(dt, frequency_axis)

        wave_data_a = mask_cone_of_influence(
            complex_spectrum=wave_data_a,
            cone_of_influence=cone_of_influence,
            fill_value=np.NaN,
        )

        wave_data_b = mask_cone_of_influence(
            complex_spectrum=wave_data_b,
            cone_of_influence=cone_of_influence,
            fill_value=np.NaN,
        )

        if trial_id == 0:
            calculation = wave_data_a * np.conj(wave_data_b)
            norm_data_a = np.abs(wave_data_a) ** 2
            norm_data_b = np.abs(wave_data_b) ** 2

        else:
            calculation += wave_data_a * np.conj(wave_data_b)
            norm_data_a += np.abs(wave_data_a) ** 2
            norm_data_b += np.abs(wave_data_b) ** 2

    calculation /= float(n_trials)
    norm_data_a /= float(n_trials)
    norm_data_b /= float(n_trials)

    coherence = np.abs(calculation) ** 2 / ((norm_data_a * norm_data_b) + 1e-20)

    return np.nanmean(coherence, axis=-1), frequency_axis, t


# Parameters for the wavelet transform
number_of_frequences: int = 3  # frequency bands
frequency_range_min: float = 5  # Hz
frequency_range_max: float = 200  # Hz
dt: float = 1.0 / 1000.0

# Test data ->
n_t: int = 10000
n_trials: int = 100

# We select one frequency because all look the same for this white random signal
frequency_select: int = 1

rng = np.random.default_rng(1)
mother_time_series_a: np.ndarray = rng.random((n_t, n_trials))
mother_time_series_a -= mother_time_series_a.mean(axis=0, keepdims=True)
mother_time_series_a /= mother_time_series_a.std(axis=0, keepdims=True)

mother_time_series_b: np.ndarray = rng.random((n_t, n_trials))
mother_time_series_b -= mother_time_series_b.mean(axis=0, keepdims=True)
mother_time_series_b /= mother_time_series_b.std(axis=0, keepdims=True)
# <- Test data

alpha_vector: np.ndarray = np.linspace(0.0, 1.0, 11, endpoint=True)


for alpha_id in trange(0, alpha_vector.shape[0]):

    alpha: float = alpha_vector[alpha_id]

    y_a = mother_time_series_a.copy()
    y_b = (1.0 - alpha) * mother_time_series_a + alpha * mother_time_series_b

    y_b -= y_b.mean(axis=0, keepdims=True)
    y_b /= y_b.std(axis=0, keepdims=True)

    temp, frequency_axis, t = calculate_spectral_coherence(
        n_trials=n_trials,
        y_a=y_a,
        y_b=y_b,
        number_of_frequences=number_of_frequences,
        frequency_range_min=frequency_range_min,
        frequency_range_max=frequency_range_max,
        dt=dt,
    )

    if alpha_id == 0:
        coherence: np.ndarray = np.zeros((temp.shape[0], alpha_vector.shape[0]))
    coherence[:, alpha_id] = temp


coherence_scaled = 1.0 / (1.0 + np.sqrt((1.0 / coherence) - 1.0))

plt.plot(alpha_vector, coherence[frequency_select, :], label="unscaled")
plt.plot(alpha_vector, coherence_scaled[frequency_select, :], label="scaled")
plt.plot([0.5, 0.5], [0, 1], "k--")
plt.plot([0, 1], [0.5, 0.5], "k--")
plt.ylabel("Spectral Coherence")
plt.xlabel("Mixture Coefficent")
plt.legend()
plt.show()
The source code is Open Source and can be found on GitHub.