Meshgrid
The goal
Questions to David Rotermund
numpy.meshgrid
numpy.meshgrid(*xi, copy=True, sparse=False, indexing='xy')
Return a list of coordinate matrices from coordinate vectors.
Make N-D coordinate arrays for vectorized evaluations of N-D scalar/vector fields over N-D grids, given one-dimensional coordinate arrays x1, x2,…, xn.
import numpy as np
import matplotlib.pyplot as plt
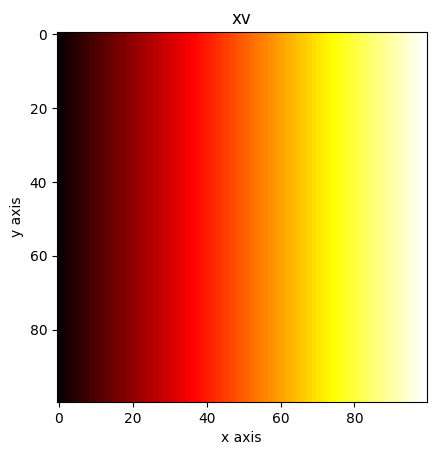
x = np.linspace(0, 1, 100)
y = np.linspace(0, 1, 100)
xv, yv = np.meshgrid(x, y)
plt.imshow(xv, cmap="hot")
plt.xlabel("x axis")
plt.ylabel("y axis")
plt.title("xv")
plt.show()
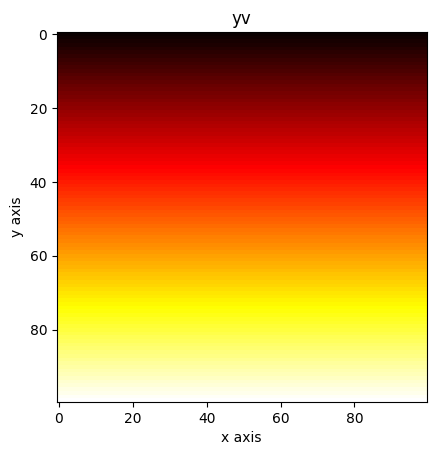
plt.imshow(yv, cmap="hot")
plt.xlabel("x axis")
plt.ylabel("y axis")
plt.title("yv")
plt.show()
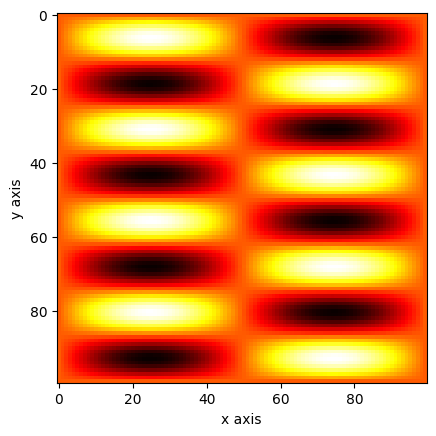
An example:
import numpy as np
import matplotlib.pyplot as plt

x = np.linspace(0, 1, 100)
y = np.linspace(0, 1, 100)

xv, yv = np.meshgrid(x, y)

a = np.sin(xv * 2 * np.pi) * np.sin(yv * 8 * np.pi)

plt.imshow(a, cmap="hot")
plt.xlabel("x axis")
plt.ylabel("y axis")
plt.show()

The question is if you really need a mesh or if just using broadcasting can do the job too. I guess this depends on your need.
import numpy as np
import matplotlib.pyplot as plt

x = np.linspace(0, 1, 100)[np.newaxis, :]
y = np.linspace(0, 1, 100)[:, np.newaxis]

a = np.sin(x * 2 * np.pi) * np.sin(y * 8 * np.pi)

plt.imshow(a, cmap="hot")
plt.xlabel("x axis")
plt.ylabel("y axis")
plt.show()
numpy.mgrid (dense meshgrid)
This is an optional topic!
numpy.mgrid = <numpy.lib.index_tricks.MGridClass object>
An instance which returns a dense multi-dimensional “meshgrid”.
An instance which returns a dense (or fleshed out) mesh-grid when indexed, so that each returned argument has the same shape. The dimensions and number of the output arrays are equal to the number of indexing dimensions. If the step length is not a complex number, then the stop is not inclusive.
However, if the step length is a complex number (e.g. 5j), then the integer part of its magnitude is interpreted as specifying the number of points to create between the start and stop values, where the stop value is inclusive.
import numpy as np

xv, yv = np.mgrid[0:5, 0:5]

print(xv)
print()
print(yv)
Output:
[[0 0 0 0 0]
 [1 1 1 1 1]
 [2 2 2 2 2]
 [3 3 3 3 3]
 [4 4 4 4 4]]

[[0 1 2 3 4]
 [0 1 2 3 4]
 [0 1 2 3 4]
 [0 1 2 3 4]
 [0 1 2 3 4]]
import numpy as np

xv, yv = np.mgrid[0:5:0.25, 0:5:0.5]

print(xv)
print()
print(yv)
Output:
[[0.   0.   0.   0.   0.   0.   0.   0.   0.   0.  ]
 [0.25 0.25 0.25 0.25 0.25 0.25 0.25 0.25 0.25 0.25]
 [0.5  0.5  0.5  0.5  0.5  0.5  0.5  0.5  0.5  0.5 ]
 [0.75 0.75 0.75 0.75 0.75 0.75 0.75 0.75 0.75 0.75]
 [1.   1.   1.   1.   1.   1.   1.   1.   1.   1.  ]
 [1.25 1.25 1.25 1.25 1.25 1.25 1.25 1.25 1.25 1.25]
 [1.5  1.5  1.5  1.5  1.5  1.5  1.5  1.5  1.5  1.5 ]
 [1.75 1.75 1.75 1.75 1.75 1.75 1.75 1.75 1.75 1.75]
 [2.   2.   2.   2.   2.   2.   2.   2.   2.   2.  ]
 [2.25 2.25 2.25 2.25 2.25 2.25 2.25 2.25 2.25 2.25]
 [2.5  2.5  2.5  2.5  2.5  2.5  2.5  2.5  2.5  2.5 ]
 [2.75 2.75 2.75 2.75 2.75 2.75 2.75 2.75 2.75 2.75]
 [3.   3.   3.   3.   3.   3.   3.   3.   3.   3.  ]
 [3.25 3.25 3.25 3.25 3.25 3.25 3.25 3.25 3.25 3.25]
 [3.5  3.5  3.5  3.5  3.5  3.5  3.5  3.5  3.5  3.5 ]
 [3.75 3.75 3.75 3.75 3.75 3.75 3.75 3.75 3.75 3.75]
 [4.   4.   4.   4.   4.   4.   4.   4.   4.   4.  ]
 [4.25 4.25 4.25 4.25 4.25 4.25 4.25 4.25 4.25 4.25]
 [4.5  4.5  4.5  4.5  4.5  4.5  4.5  4.5  4.5  4.5 ]
 [4.75 4.75 4.75 4.75 4.75 4.75 4.75 4.75 4.75 4.75]]

[[0.  0.5 1.  1.5 2.  2.5 3.  3.5 4.  4.5]
 [0.  0.5 1.  1.5 2.  2.5 3.  3.5 4.  4.5]
 [0.  0.5 1.  1.5 2.  2.5 3.  3.5 4.  4.5]
 [0.  0.5 1.  1.5 2.  2.5 3.  3.5 4.  4.5]
 [0.  0.5 1.  1.5 2.  2.5 3.  3.5 4.  4.5]
 [0.  0.5 1.  1.5 2.  2.5 3.  3.5 4.  4.5]
 [0.  0.5 1.  1.5 2.  2.5 3.  3.5 4.  4.5]
 [0.  0.5 1.  1.5 2.  2.5 3.  3.5 4.  4.5]
 [0.  0.5 1.  1.5 2.  2.5 3.  3.5 4.  4.5]
 [0.  0.5 1.  1.5 2.  2.5 3.  3.5 4.  4.5]
 [0.  0.5 1.  1.5 2.  2.5 3.  3.5 4.  4.5]
 [0.  0.5 1.  1.5 2.  2.5 3.  3.5 4.  4.5]
 [0.  0.5 1.  1.5 2.  2.5 3.  3.5 4.  4.5]
 [0.  0.5 1.  1.5 2.  2.5 3.  3.5 4.  4.5]
 [0.  0.5 1.  1.5 2.  2.5 3.  3.5 4.  4.5]
 [0.  0.5 1.  1.5 2.  2.5 3.  3.5 4.  4.5]
 [0.  0.5 1.  1.5 2.  2.5 3.  3.5 4.  4.5]
 [0.  0.5 1.  1.5 2.  2.5 3.  3.5 4.  4.5]
 [0.  0.5 1.  1.5 2.  2.5 3.  3.5 4.  4.5]
 [0.  0.5 1.  1.5 2.  2.5 3.  3.5 4.  4.5]]
import numpy as np
import matplotlib.pyplot as plt

xv, yv = np.mgrid[0:1:0.01, 0:1:0.01]

a = np.sin(xv * 2 * np.pi) * np.sin(yv * 8 * np.pi)

plt.imshow(a, cmap="hot")
plt.xlabel("x axis")
plt.ylabel("y axis")
plt.show()

numpy.ogrid (open meshgrid)
This is an optional topic!
numpy.ogrid = <numpy.lib.index_tricks.OGridClass object>
An instance which returns an open multi-dimensional “meshgrid”.
An instance which returns an open (i.e. not fleshed out) mesh-grid when indexed, so that only one dimension of each returned array is greater than 1. The dimension and number of the output arrays are equal to the number of indexing dimensions. If the step length is not a complex number, then the stop is not inclusive.
However, if the step length is a complex number (e.g. 5j), then the integer part of its magnitude is interpreted as specifying the number of points to create between the start and stop values, where the stop value is inclusive.
import numpy as np

xv, yv = np.ogrid[0:5, 0:5]

print(xv)
print()
print(yv)
Output:
[[0]
 [1]
 [2]
 [3]
 [4]]

[[0 1 2 3 4]]
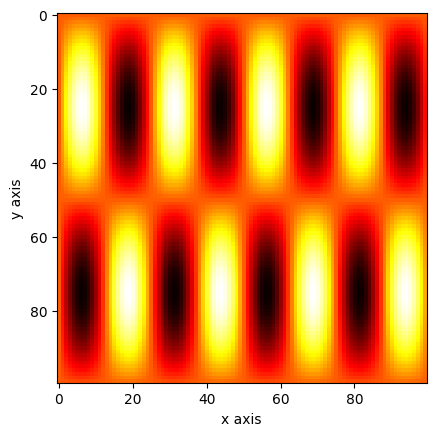
An example:
import numpy as np
import matplotlib.pyplot as plt

xv, yv = np.ogrid[0:1:0.01, 0:1:0.01]

a = np.sin(xv * 2 * np.pi) @ np.sin(yv * 8 * np.pi)

plt.imshow(a, cmap="hot")
plt.xlabel("x axis")
plt.ylabel("y axis")
plt.show()
Note the matrix multiplication @
numpy.indices
This is an optional topic!
numpy.indices(dimensions, dtype=<class 'int'>, sparse=False)
Return an array representing the indices of a grid.
Compute an array where the subarrays contain index values 0, 1, … varying only along the corresponding axis.
import numpy as np

a, b = np.indices((3,4))

print(a)
print()
print(b)
Output:
[[0 0 0 0]
 [1 1 1 1]
 [2 2 2 2]]

[[0 1 2 3]
 [0 1 2 3]
 [0 1 2 3]]
numpy.ix_ (open mesh)
This is an optional topic!
numpy.ix_(*args)
Construct an open mesh from multiple sequences.
This function takes N 1-D sequences and returns N outputs with N dimensions each, such that the shape is 1 in all but one dimension and the dimension with the non-unit shape value cycles through all N dimensions.
Using ix_ one can quickly construct index arrays that will index the cross product. a[np.ix_([1,3],[2,5])] returns the array [[a[1,2] a[1,5]], [a[3,2] a[3,5]]].
import numpy as np

a, b = np.ix_(np.arange(2, 8), np.arange(4, 12))
print(a)
print(a.shape) # -> (6, 1)
print()
print(b) # -> [[ 4  5  6  7  8  9 10 11]]
print(b.shape) # -> (1, 8)
Output:
[[2]
 [3]
 [4]
 [5]
 [6]
 [7]]
import numpy as np

a, b = np.ix_([True, False, False, True, True], [True, True, False, False, True])
print(a)
print(a.shape)  # -> (3, 1)
print()
print(b)  # -> [[0 1 4]]
print(b.shape)  # -> (1, 3)
Output:
[[0]
 [3]
 [4]]
import numpy as np

a = np.arange(1, 10).reshape(3, 3)

print(a)
print()

x = a.sum(axis=1) > 6
y = [0, 2]
print(x) # -> [False  True  True]
print(y) # -> [0, 2]

b = np.zeros_like(a)
b[x, y] = 1
print(b)
print()

b = np.zeros_like(a)
b[np.ix_(x, y)] = 1
print(b)
Output:
[[1 2 3]
 [4 5 6]
 [7 8 9]]

[[0 0 0]
 [1 0 0]
 [0 0 1]]

[[0 0 0]
 [1 0 1]
 [1 0 1]]
The source code is Open Source and can be found on GitHub.