ROC
Top
Questions to David Rotermund
The following code is for the case where the amount of data for both classes is the same.
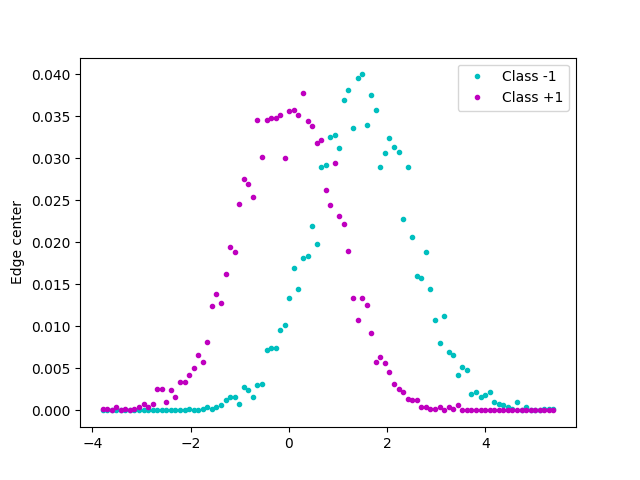
Test data
import numpy as np
import matplotlib.pyplot as plt

rng = np.random.default_rng(1)

a_x = rng.normal(1.5, 1.0, size=(5000))
b_x = rng.normal(0.0, 1.0, size=(5000))


ab_x = np.concatenate([a_x, b_x])
edges = np.histogram_bin_edges(ab_x, bins=100, range=None, weights=None)

h_a, _ = np.histogram(a_x, bins=edges)
h_b, _ = np.histogram(b_x, bins=edges)

h_a = h_a.astype(np.float32)
h_b = h_b.astype(np.float32)

h_a /= h_a.sum()
h_b /= h_b.sum()

edges = (edges[1:] + edges[:-1]) / 2.0

plt.plot(edges, h_a, "c.", label="Class -1")
plt.plot(edges, h_b, "m.", label="Class +1")
plt.ylabel("Probability of a value")
plt.ylabel("Edge center")
plt.legend()
plt.show()
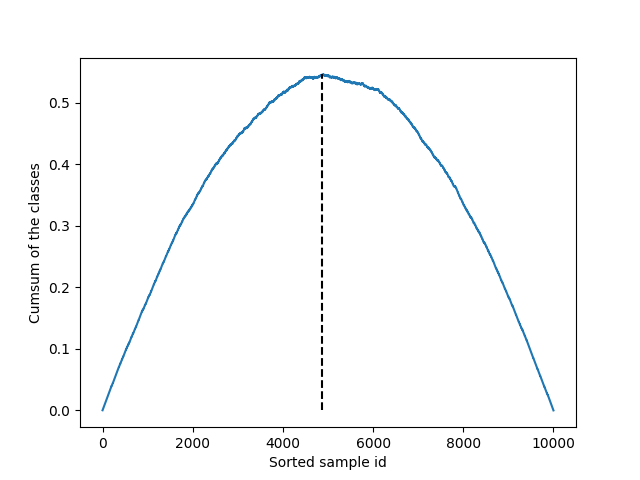
Find the cumsum maximum
import numpy as np
import matplotlib.pyplot as plt

rng = np.random.default_rng(1)

a_x = rng.normal(1.5, 1.0, size=(5000))
b_x = rng.normal(0.0, 1.0, size=(5000))

data_data = np.concatenate([a_x, b_x])
data_class = np.concatenate(
    [np.full_like(a_x, -1 / a_x.shape[0]), np.full_like(b_x, +1 / b_x.shape[0])]
)
idx = np.argsort(data_data)

data_data = data_data[idx]
data_class = data_class[idx]

data_cumsum = np.cumsum(data_class)

plt.plot(data_cumsum)
plt.plot(
    [np.argmax(data_cumsum), np.argmax(data_cumsum)], [0, np.max(data_cumsum)], "k--"
)
plt.ylabel("Cumsum of the classes")
plt.xlabel("Sorted sample id")
plt.show()
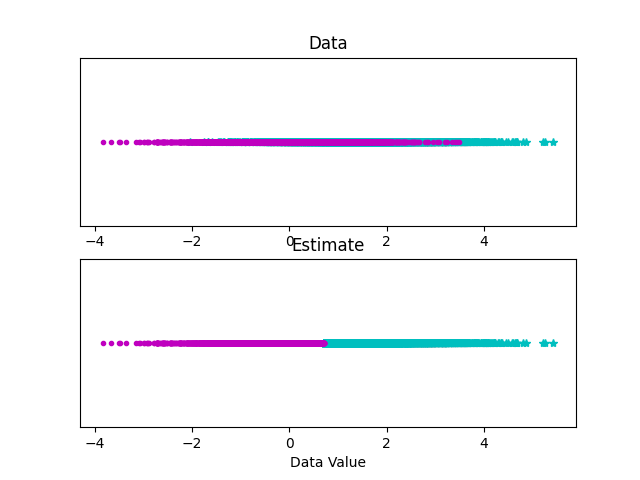
How to create an estimate from the ROC cumsum maximum
import numpy as np
import matplotlib.pyplot as plt

rng = np.random.default_rng(1)

a_x = rng.normal(1.5, 1.0, size=(5000))
b_x = rng.normal(0.0, 1.0, size=(5000))

data_data = np.concatenate([a_x, b_x])
data_class = np.concatenate(
    [np.full_like(a_x, -1 / a_x.shape[0]), np.full_like(b_x, +1 / b_x.shape[0])]
)
data_class_id = np.concatenate([np.full_like(a_x, -1), np.full_like(b_x, +1)])
idx = np.argsort(data_data)

data_data = data_data[idx]
data_class = data_class[idx]
data_class_id = data_class_id[idx]

data_cumsum = np.cumsum(data_class)
border = np.argmax(np.abs(data_cumsum))

if data_cumsum[border] < 0:
    estimate = np.concatenate(
        (
            np.full_like(data_class[: border + 1], -1),
            np.full_like(data_class[border + 1 :], +1),
        )
    )

else:
    estimate = np.concatenate(
        (
            np.full_like(data_class[: border + 1], +1),
            np.full_like(data_class[border + 1 :], -1),
        )
    )


performance = 100.0 * (data_class_id == estimate).sum() / data_class_id.shape[0]
print(f"Performance: {performance}% correct")

plt.subplot(2, 1, 1)
idx_a = np.where(data_class < 0)[0]
idx_b = np.where(data_class > 0)[0]
idx = np.arange(0, data_class.shape[0])

plt.plot(data_data[idx_a], np.zeros_like(idx_a), "c*")
plt.plot(data_data[idx_b], np.zeros_like(idx_b), "m.")
plt.yticks([])
plt.title("Data")

plt.subplot(2, 1, 2)
idx_a = np.where(estimate < 0)[0]
idx_b = np.where(estimate > 0)[0]
idx = np.arange(0, estimate.shape[0])

plt.plot(data_data[idx_a], np.zeros_like(idx_a), "c*")
plt.plot(data_data[idx_b], np.zeros_like(idx_b), "m.")
plt.yticks([])
plt.title("Estimate")
plt.xlabel("Data Value")
plt.show()
Output:
Performance: 77.31% correct
The source code is Open Source and can be found on GitHub.