KMeans
The goal
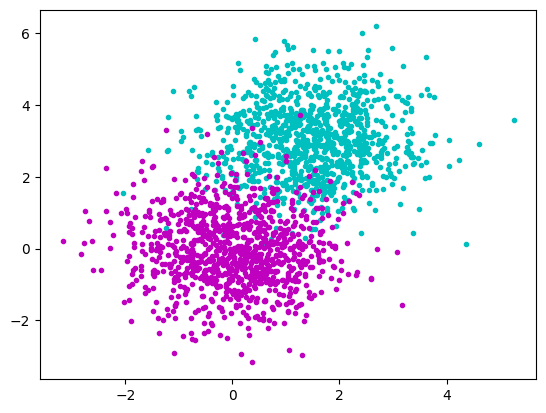
KMeans allows to find clusters in a data set.
Questions to David Rotermund
Test data
import numpy as np
import matplotlib.pyplot as plt

rng = np.random.default_rng(1)

rng = np.random.default_rng()

a_x = rng.normal(1.5, 1.0, size=(1000))
a_y = rng.normal(3.0, 1.0, size=(1000))

b_x = rng.normal(0.0, 1.0, size=(1000))
b_y = rng.normal(0.0, 1.0, size=(1000))

plt.plot(a_x, a_y, "c.")
plt.plot(b_x, b_y, "m.")
plt.show()
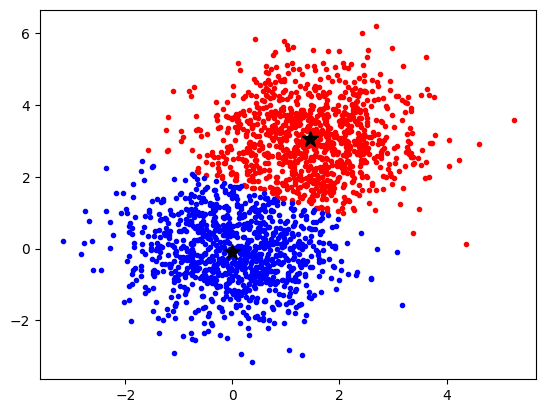
sklearn.cluster.KMeans and its fit
class sklearn.cluster.KMeans(n_clusters=8, *, init='k-means++', n_init='warn', max_iter=300, tol=0.0001, verbose=0, random_state=None, copy_x=True, algorithm='lloyd')
K-Means clustering.
Attribute:
cluster_centers_ : ndarray of shape (n_clusters, n_features) Coordinates of cluster centers. If the algorithm stops before fully converging (see tol and max_iter), these will not be consistent with labels_.
Method:
fit(X, y=None, sample_weight=None)
Compute k-means clustering X: {array-like, sparse matrix} of shape (n_samples, n_features) Training instances to cluster. It must be noted that the data will be converted to C ordering, which will cause a memory copy if the given data is not C-contiguous. If a sparse matrix is passed, a copy will be made if it’s not in CSR format.
import numpy as np
import matplotlib.pyplot as plt
from sklearn.cluster import KMeans

rng = np.random.default_rng(1)

a_x = rng.normal(1.5, 1.0, size=(1000))[:, np.newaxis]
a_y = rng.normal(3.0, 1.0, size=(1000))[:, np.newaxis]
data_a = np.concatenate((a_x, a_y), axis=1)

b_x = rng.normal(0.0, 1.0, size=(1000))[:, np.newaxis]
b_y = rng.normal(0.0, 1.0, size=(1000))[:, np.newaxis]
data_b = np.concatenate((b_x, b_y), axis=1)

data = np.concatenate((data_a, data_b), axis=0)

kmeans = KMeans(n_clusters=2, n_init = 10)
kmeans.fit(data)


plt.plot(a_x, a_y, "c.")
plt.plot(b_x, b_y, "m.")
plt.plot(
    kmeans.cluster_centers_[0, 0], kmeans.cluster_centers_[0, 1], "k*", markersize=12
)
plt.plot(
    kmeans.cluster_centers_[1, 0], kmeans.cluster_centers_[1, 1], "k*", markersize=12
)

plt.show()

labels_ : ndarray of shape (n_samples,) Labels of each point
What does the algorithm „think“ where the data points belong?
import numpy as np
import matplotlib.pyplot as plt
from sklearn.cluster import KMeans

rng = np.random.default_rng(1)

a_x = rng.normal(1.5, 1.0, size=(1000))[:, np.newaxis]
a_y = rng.normal(3.0, 1.0, size=(1000))[:, np.newaxis]
data_a = np.concatenate((a_x, a_y), axis=1)

b_x = rng.normal(0.0, 1.0, size=(1000))[:, np.newaxis]
b_y = rng.normal(0.0, 1.0, size=(1000))[:, np.newaxis]
data_b = np.concatenate((b_x, b_y), axis=1)

data = np.concatenate((data_a, data_b), axis=0)

kmeans = KMeans(n_clusters=2, n_init = 10)
kmeans.fit(data)

labels = kmeans.labels_
idx_0 = np.where(labels == 0)[0]
idx_1 = np.where(labels == 1)[0]

plt.plot(data[idx_0, 0], data[idx_0, 1], "r.")
plt.plot(data[idx_1, 0], data[idx_1, 1], "b.")
plt.plot(
    kmeans.cluster_centers_[0, 0], kmeans.cluster_centers_[0, 1], "k*", markersize=12
)
plt.plot(
    kmeans.cluster_centers_[1, 0], kmeans.cluster_centers_[1, 1], "k*", markersize=12
)

plt.show()
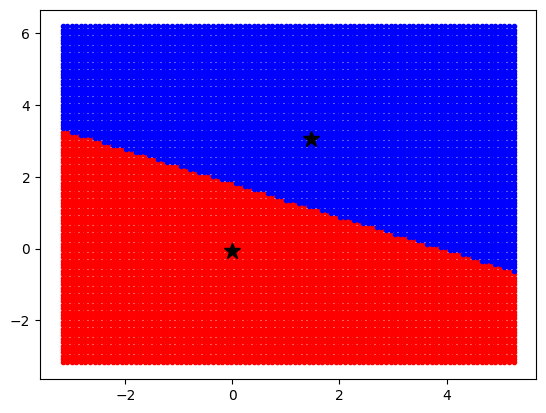
predict
predict(X, sample_weight='deprecated')
Predict the closest cluster each sample in X belongs to.
In the vector quantization literature, cluster_centers_ is called the code book and each value returned by predict is the index of the closest code in the code book.
import numpy as np
import matplotlib.pyplot as plt
from sklearn.cluster import KMeans

rng = np.random.default_rng(1)

a_x = rng.normal(1.5, 1.0, size=(1000))[:, np.newaxis]
a_y = rng.normal(3.0, 1.0, size=(1000))[:, np.newaxis]
data_a = np.concatenate((a_x, a_y), axis=1)

b_x = rng.normal(0.0, 1.0, size=(1000))[:, np.newaxis]
b_y = rng.normal(0.0, 1.0, size=(1000))[:, np.newaxis]
data_b = np.concatenate((b_x, b_y), axis=1)

data = np.concatenate((data_a, data_b), axis=0)

kmeans = KMeans(n_clusters=2, n_init=10)
kmeans.fit(data)


x = np.linspace(data[:, 0].min(), data[:, 0].max(), 100)
y = np.linspace(data[:, 1].min(), data[:, 1].max(), 100)
xx, yy = np.meshgrid(x, y)

xx_r = xx.ravel()[:, np.newaxis]
yy_r = yy.ravel()[:, np.newaxis]

print(xx.shape)  # -> (100, 100)
print(xx_r.shape)  # -> (10000, 1)
print(yy.shape)  # -> (100, 100)
print(yy_r.shape)  # -> (10000, 1)

coordinates = np.concatenate((xx_r, yy_r), axis=1)
print(coordinates.shape)  # -> (10000, 2)

labels = kmeans.predict(coordinates)
idx_0 = np.where(labels == 0)[0]
idx_1 = np.where(labels == 1)[0]


plt.plot(coordinates[idx_0, 0], coordinates[idx_0, 1], "r.")
plt.plot(coordinates[idx_1, 0], coordinates[idx_1, 1], "b.")
plt.plot(
    kmeans.cluster_centers_[0, 0], kmeans.cluster_centers_[0, 1], "k*", markersize=12
)
plt.plot(
    kmeans.cluster_centers_[1, 0], kmeans.cluster_centers_[1, 1], "k*", markersize=12
)

plt.show()
KMeans methods
| fit(X[, y, sample_weight]) | Compute k-means clustering. |
| fit_predict(X[, y, sample_weight]) | Compute cluster centers and predict cluster index for each sample. |
| fit_transform(X[, y, sample_weight]) | Compute clustering and transform X to cluster-distance space. |
| get_feature_names_out([input_features]) | Get output feature names for transformation. |
| get_metadata_routing() | Get metadata routing of this object. |
| get_params([deep]) | Get parameters for this estimator. |
| predict(X[, sample_weight]) | Predict the closest cluster each sample in X belongs to. |
| score(X[, y, sample_weight]) | Opposite of the value of X on the K-means objective. |
| set_fit_request(*[, sample_weight]) | Request metadata passed to the fit method. |
| set_output(*[, transform]) | Set output container. |
| set_params(**params) | Set the parameters of this estimator. |
| set_predict_request(*[, sample_weight]) | Request metadata passed to the predict method. |
| set_score_request(*[, sample_weight]) | Request metadata passed to the score method. |
| transform(X) | Transform X to a cluster-distance space. |
KMeans Attributes
cluster_centers_ : ndarray of shape (n_clusters, n_features)
Coordinates of cluster centers. If the algorithm stops before fully converging (see tol and max_iter), these will not be consistent with labels_.
labels_ ndarray of shape (n_samples,)
Labels of each point
inertia_ : float
Sum of squared distances of samples to their closest cluster center, weighted by the sample weights if provided.
n_iter_ : int
Number of iterations run.
n_features_in_ : int
Number of features seen during fit.
feature_names_in_ : ndarray of shape (n_features_in_,)
Names of features seen during fit. Defined only when X has feature names that are all strings.
The source code is Open Source and can be found on GitHub.