Fisher Exact Test
Top
Questions to David Rotermund
scipy.stats.fisher_exact
scipy.stats.fisher_exact(table, alternative='two-sided')
Perform a Fisher exact test on a 2x2 contingency table.
The null hypothesis is that the true odds ratio of the populations underlying the observations is one, and the observations were sampled from these populations under a condition: the marginals of the resulting table must equal those of the observed table. The statistic returned is the unconditional maximum likelihood estimate of the odds ratio, and the p-value is the probability under the null hypothesis of obtaining a table at least as extreme as the one that was actually observed. There are other possible choices of statistic and two-sided p-value definition associated with Fisher’s exact test; please see the Notes for more information.
Parameters:
alternative : {‘two-sided’, ‘less’, ‘greater’}, optional Defines the alternative hypothesis. The following options are available (default is ‘two-sided’):
- ‘two-sided’: the odds ratio of the underlying population is not one (The two-sided p-value is the probability that, under the null hypothesis, a random table would have a probability equal to or less than the probability of the input table.)
- ‘less’: the odds ratio of the underlying population is less than one
- ‘greater’: the odds ratio of the underlying population is greater than one
Returns:
res : SignificanceResult
An object containing attributes:
statistic : float
This is the prior odds ratio, not a posterior estimate.
pvalue : float
The probability under the null hypothesis of obtaining a table at least as extreme as the one that was actually observed.
The input table is [[a, b], [c, d]].
| a | b |
| c | d |
Where $N_A = a + c$ for the elements in group A (performance values of network A with $N_A$ as number of test pattern) and $N_B = b + d$ for the elements in group B (performance values of network B with $N_B$ as number of test pattern).
| $N_A - c$ | $N_B-d$ |
| c | d |
If network architectures are tested, typically, the same data set is used in both conditions and such $N = N_A = N_B$.
| $N - c$ | $N - d$ |
| c | d |
Example
| Group A | Group B | |
|---|---|---|
| Yes | 7 | 17 |
| No | 15 | 5 |
This translates in to the table: [[7, 17], [15, 5]]
from scipy.stats import fisher_exact

res = fisher_exact([[7, 17], [15, 5]], alternative="less")
print(res.statistic) # -> 0.13725490196078433
print(res.pvalue) # -> 0.0028841933752349743
Network performance analysis
from scipy.stats import fisher_exact
import numpy as np
import matplotlib.pyplot as plt
N: int = 10000
correct_b: int = N // 2
values = np.arange(0, N + 1, 100)
results_less = np.zeros((values.shape[0]))
results_greater = np.zeros((values.shape[0]))
results_two_sided = np.zeros((values.shape[0]))
for i in range(0, values.shape[0]):
correct_a: int = int(values[i])
res = fisher_exact(
[[N - correct_a, N - correct_b], [correct_a, correct_b]], alternative="less"
)
results_less[i] = res.pvalue
for i in range(0, values.shape[0]):
correct_a = int(values[i])
res = fisher_exact(
[[N - correct_a, N - correct_b], [correct_a, correct_b]], alternative="greater"
)
results_greater[i] = res.pvalue
for i in range(0, values.shape[0]):
correct_a = int(values[i])
res = fisher_exact(
[[N - correct_a, N - correct_b], [correct_a, correct_b]],
alternative="two-sided",
)
results_two_sided[i] = res.pvalue
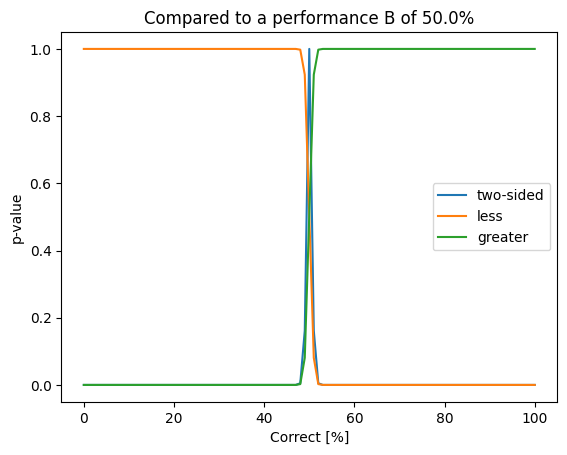
plt.plot(100.0 * values / N, results_two_sided, label="two-sided")
plt.plot(100.0 * values / N, results_less, label="less")
plt.plot(100.0 * values / N, results_greater, label="greater")
plt.title(f"Compared to a performance B of {100.0 * correct_b /N}%")
plt.ylabel("p-value")
plt.xlabel("Correct [%]")
plt.legend()
plt.show()
from scipy.stats import fisher_exact
import numpy as np
import matplotlib.pyplot as plt
N: int = 10000
correct_b: int = int(N * 0.99)
values = np.arange(int(N * 0.98), N + 1)
results_less = np.zeros((values.shape[0]))
results_greater = np.zeros((values.shape[0]))
results_two_sided = np.zeros((values.shape[0]))
for i in range(0, values.shape[0]):
correct_a: int = int(values[i])
res = fisher_exact(
[[N - correct_a, N - correct_b], [correct_a, correct_b]], alternative="less"
)
results_less[i] = res.pvalue
for i in range(0, values.shape[0]):
correct_a = int(values[i])
res = fisher_exact(
[[N - correct_a, N - correct_b], [correct_a, correct_b]], alternative="greater"
)
results_greater[i] = res.pvalue
for i in range(0, values.shape[0]):
correct_a = int(values[i])
res = fisher_exact(
[[N - correct_a, N - correct_b], [correct_a, correct_b]],
alternative="two-sided",
)
results_two_sided[i] = res.pvalue
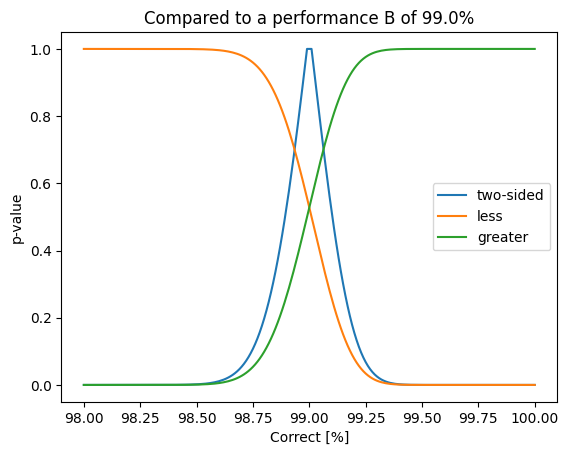
plt.plot(100.0 * values / N, results_two_sided, label="two-sided")
plt.plot(100.0 * values / N, results_less, label="less")
plt.plot(100.0 * values / N, results_greater, label="greater")
plt.title(f"Compared to a performance B of {100.0 * correct_b /N}%")
plt.ylabel("p-value")
plt.xlabel("Correct [%]")
plt.legend()
plt.show()
The source code is Open Source and can be found on GitHub.